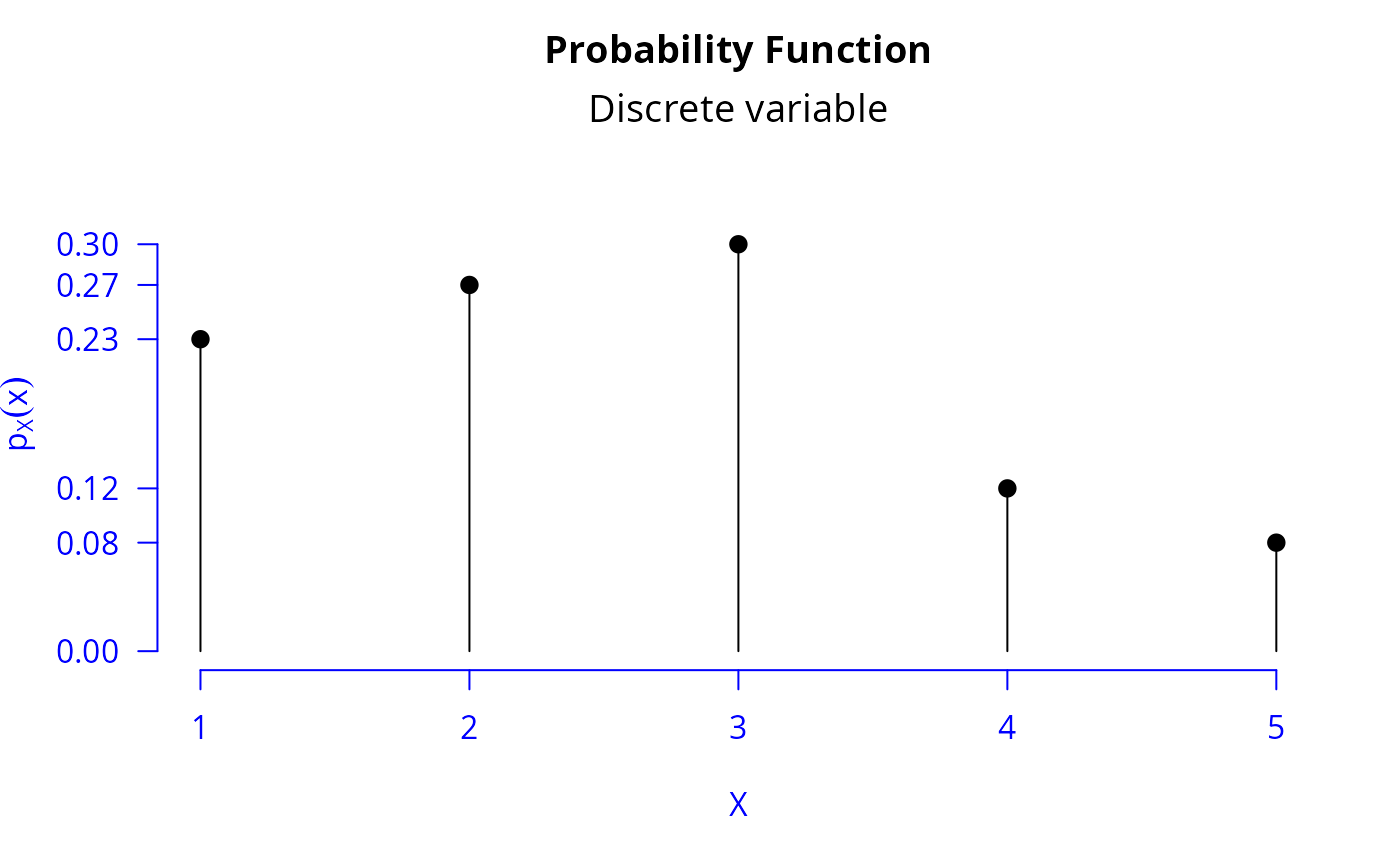
Help in building the plot of the probability function of any discrete variable
Details
Consider the \(X\) distribution:
| \(p_X(x)\): | 0.23 | 0.27 | 0.30 | 0.12 | 0.08 |
| \(x\): | 1 | 2 | 3 | 4 | 5 |
where \(p_X(x)\) and \(x\) are probability function and values of \(X\). See Example 1.
Examples
# Example 1
x <- 1:5
p <- c(0.23, 0.27,0.30, 0.12, 0.08)
apf(x, p)

