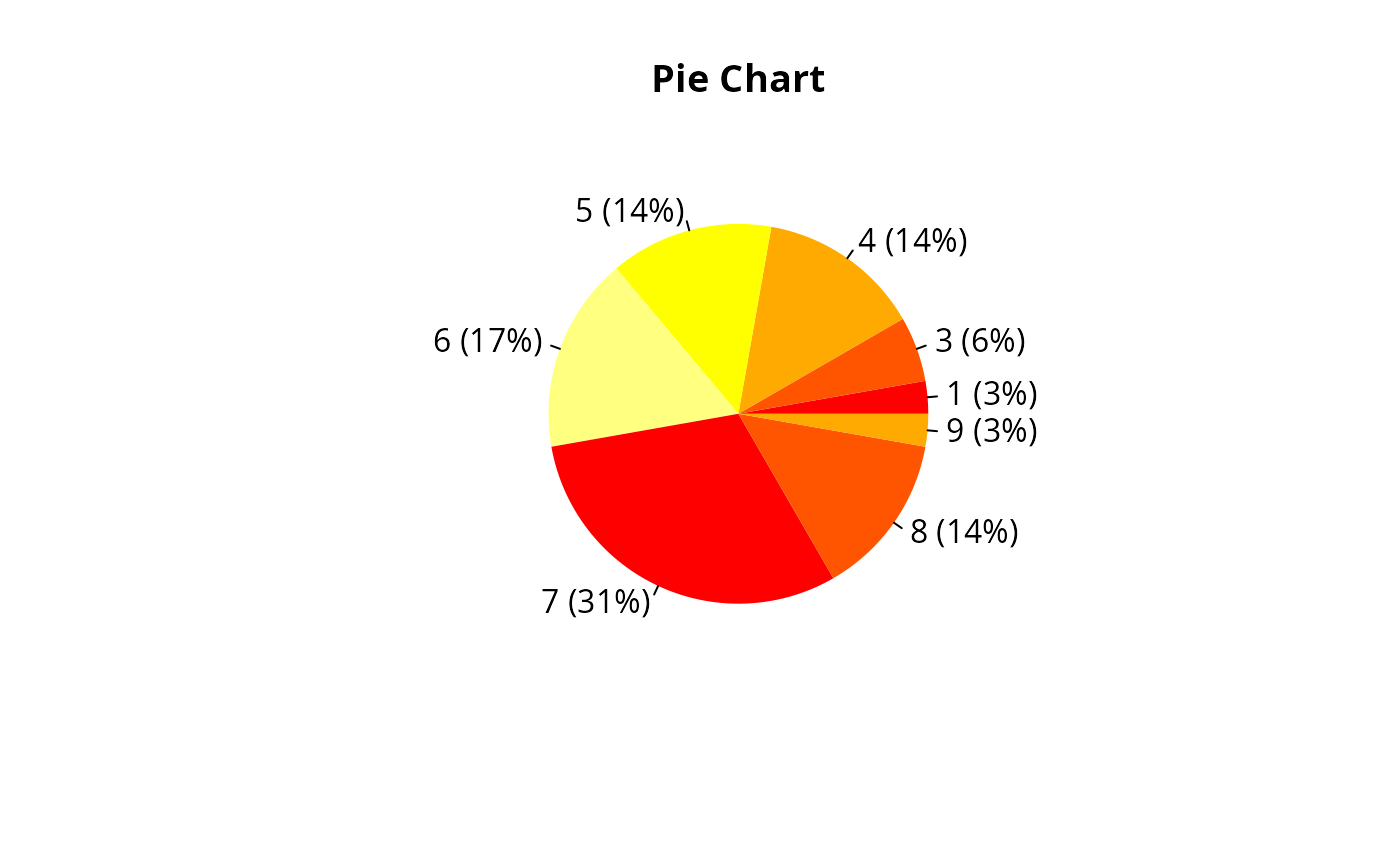
Draw a pie chart.
Usage
piechart(
  x,
  labels = NULL,
  col = heat.colors(5, 1),
  border = FALSE,
  main = NULL,
  ...
)
Arguments
- x
R object (list) of class leem. Use
new_leem()function.- labels
One or more expressions or character strings giving names for the slices
- col
Character vector. Default
col = heat.colors(5).- border
Logical argument (default
FALSE).- main
Title name.
- ...
further arguments passed to or from other methods.

