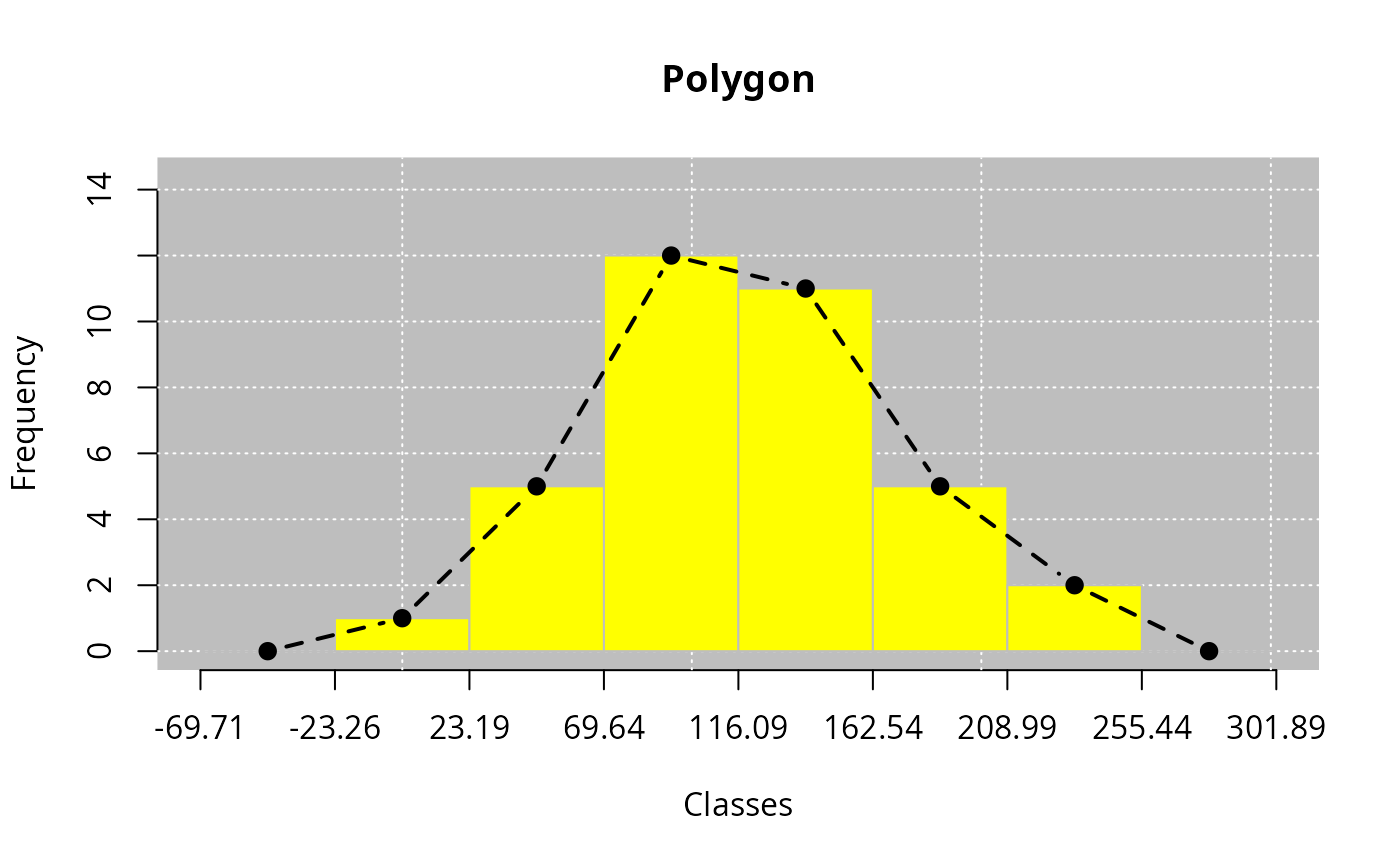
Plot the frequency polygon curve.
Arguments
- x
R object (list) of class leem. Use
new_leem()function.- freq
Character argument. Type of frequency with options:
"a"(absolute and default),"r"relative and"p"percentage.- type
Type of plot. The default is
type = "b", i.e., line and points. Seegraphical parameterfor details.- bars
Logical argument. Default is
FALSE. Ifbars = TRUE, the histogram will be inserted to plot.- bg
Logical argument. Default is
TRUE, it displays the background, andbg = FALSEotherwise.- main
Insert the plot title. The default is
NULL.- xlab
Insert the title of the x-axis graphic label. The default is
NULL.- ylab
Insert the title of the y-axis graphic label. The default is
NULL.- grids
Insert grids to plot. The default is
grid(col = "white").- bgcol
Insert the background color. This argument is only valid when
bg = TRUE. The default isbgcol="gray".- bgborder
Insert the background border color. This argument is only valid when
bg = TRUE. The default is bgborder = NA.- barcol
Insert the barplot color. The default is
barcol = "yellow". This argument is only valid whenbars = TRUE.- barborder
Insert the barplot border color. This argument is only valid when
bars = TRUE. The default is barborder = "gray".- lpcol
Type of line color. The default is
lpcol = "black".- lwd
numeric argument. The line width. The default is
lwd = 2.- pch
Type of point. The default is
pch = 19.- lty
Type of line. The default is
lty = 2.- ...
further arguments passed to or from other methods.