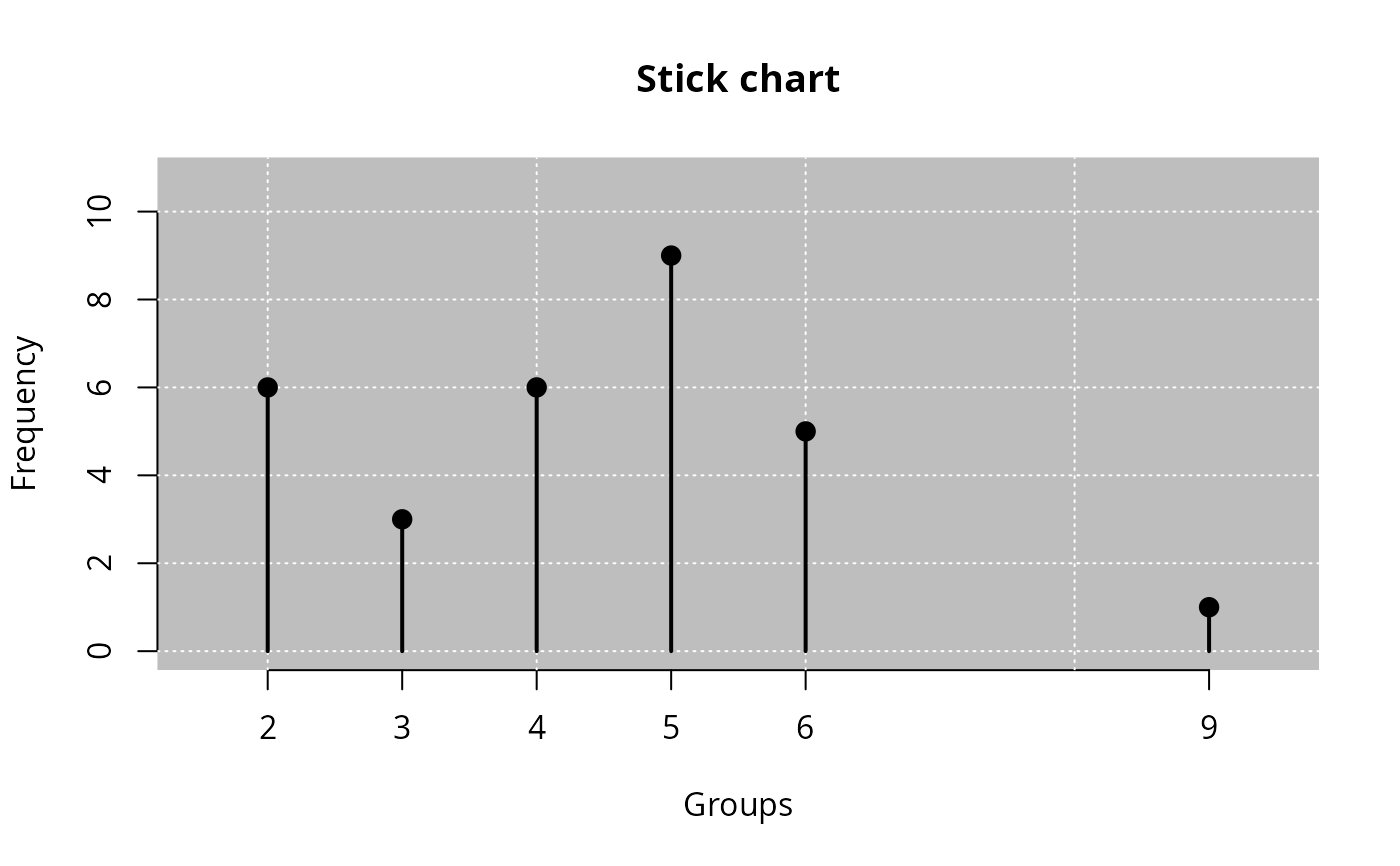
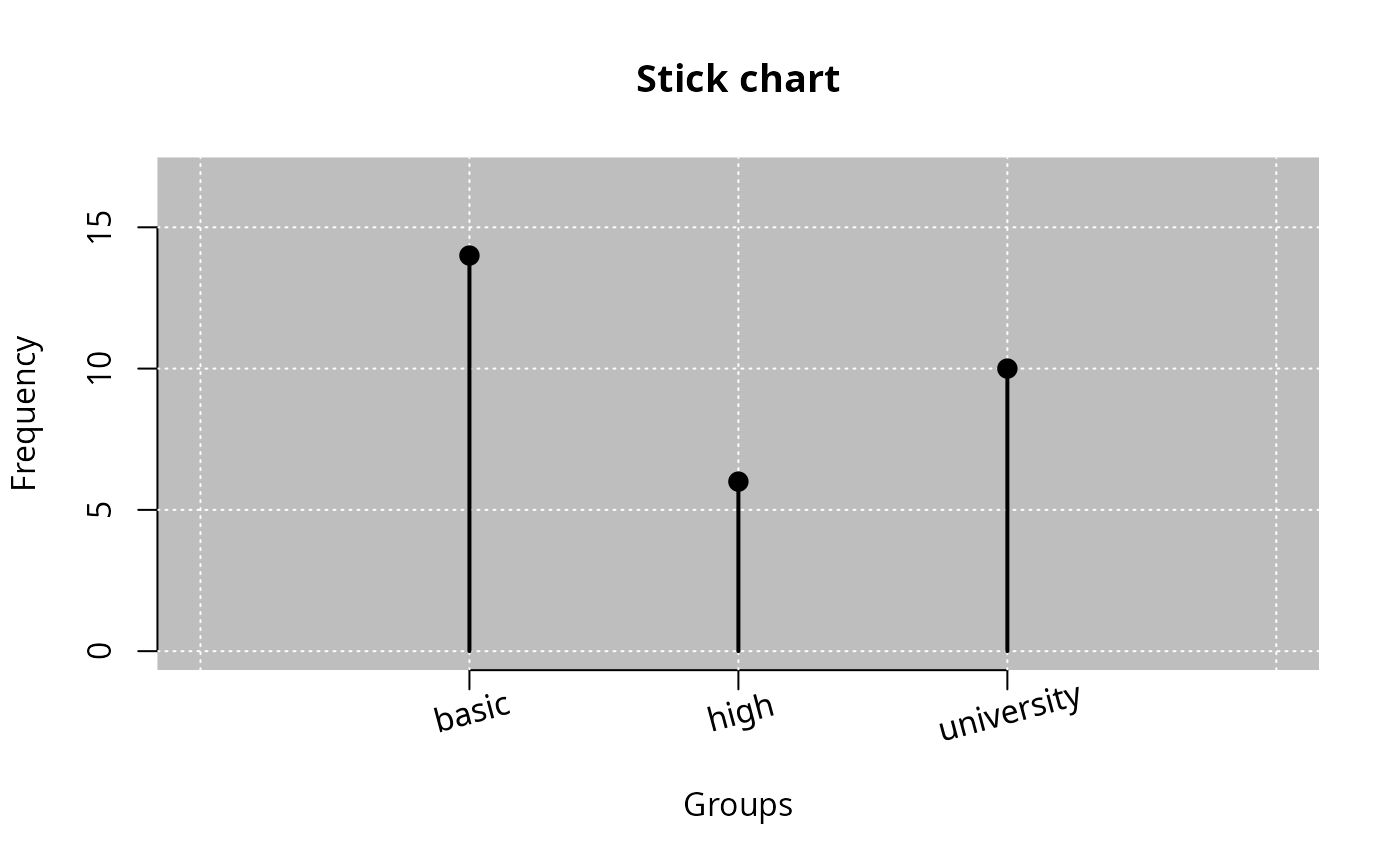
Stick chart for discrete data
Usage
stickchart(
  x,
  freq = "a",
  bg = TRUE,
  main = NULL,
  xlab = NULL,
  ylab = NULL,
  grids = grid(col = "white"),
  bgcol = "gray",
  bgborder = NA,
  posx1 = 0,
  posx2 = 0,
  xang = 0,
  labels = NULL,
  lcol = "black",
  pcol = lcol,
  pty = 19,
  pwd = 3,
  lty = 1,
  lwd = 2,
  ...
)
Arguments
- x
R object (list) of class leem. Use
new_leem()function.- freq
Character argument. Type of frequency with options:
"a"(absolute and default),"r"relative and"p"percentage.- bg
Logical argument. Default is
TRUE, it displays the background, andbg = FALSEotherwise.- main
Insert the plot title. The default is
NULL.- xlab
Insert the title of the x-axis graphic label. The default is
NULL.- ylab
Insert the title of the y-axis graphic label. The default is
NULL.- grids
Insert grids to plot. The default is
grid(col = "white").- bgcol
Insert the background color. This argument is only valid when
bg = TRUE. The default isbgcol="gray".- bgborder
Insert the background border color. This argument is only valid when
bg = TRUE. The default is bgborder = NA.- posx1
Numeric argument.Distance of the labels (horizontal) in relation to the x axis.
- posx2
Numeric argument.Distance of the labels (vertical) in relation to the x axis.
- xang
Numeric argument.Angle of the labels in relation to the x axis
- labels
Character argument. Labels name vector.
- lcol
Line color. The default is
lcol = "black".- pcol
Point color. The default is
pcol = lcol.- pty
Point type. The default is
pty = 19.- pwd
Point width. The default is
pwd = 3.- lty
Line type. The default is
lty = 2.- lwd
Line width. The default is
lwd = 2.- ...
further arguments passed to or from other methods.