MRbarplot creates a bar plot with vertical or horizontal bars
to compare the mean treatments by the tests:
means grouping based on midrange, means grouping based on range,
Student-Newman-Keuls and Tukey based on midrange.
MRbarplot(x, MCP = "all", col = grDevices::heat.colors(10), horiz = FALSE, ...)
Arguments
| x | An object of the |
|---|---|
| MCP | Allows choosing the multiple comparison test.
The defaut is "all". This option will perform all tests
available in the |
| col | A specification for the plotting color.
The defaut is |
| horiz | a logical value. If |
| ... | Parameters of the |
Value
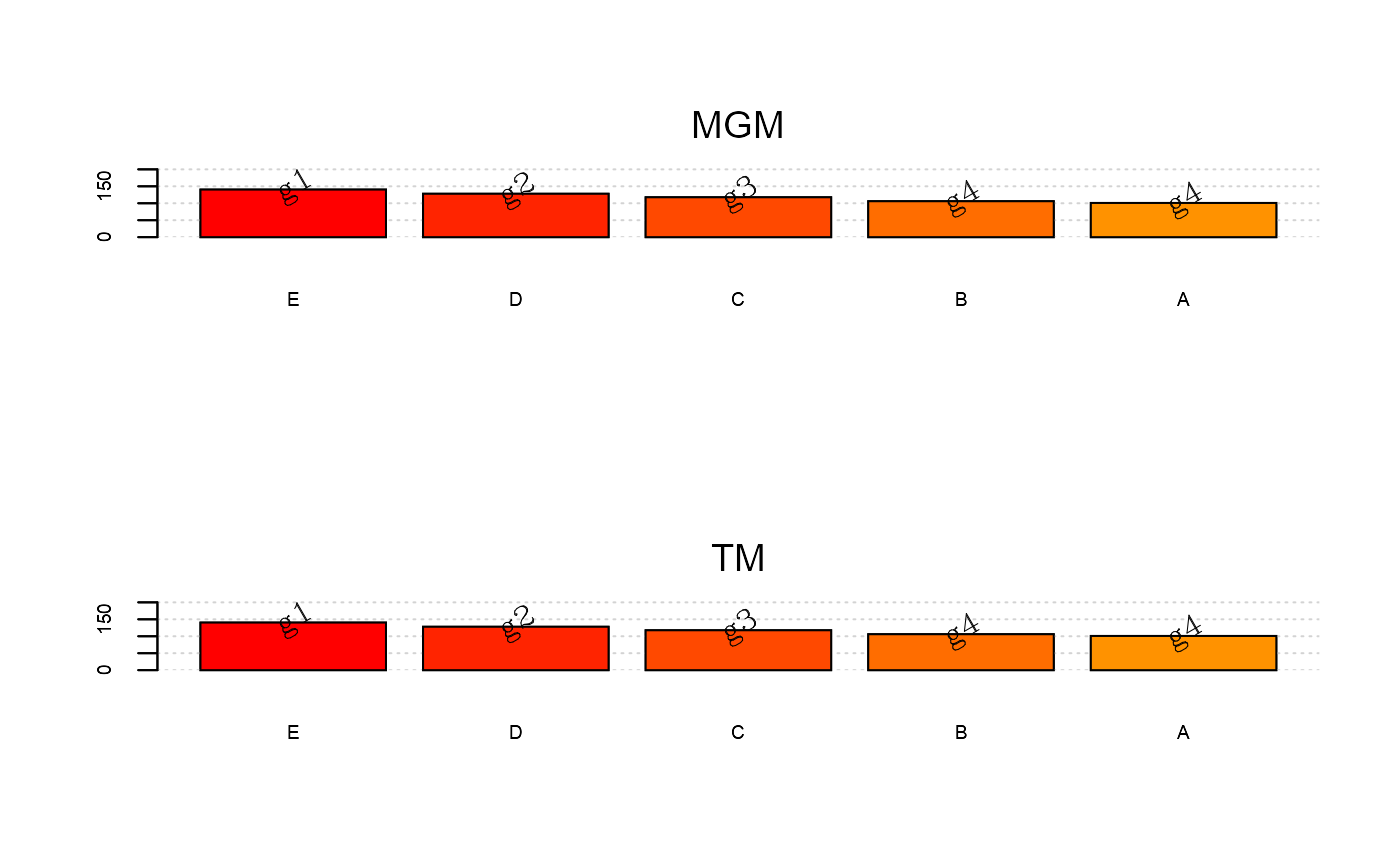
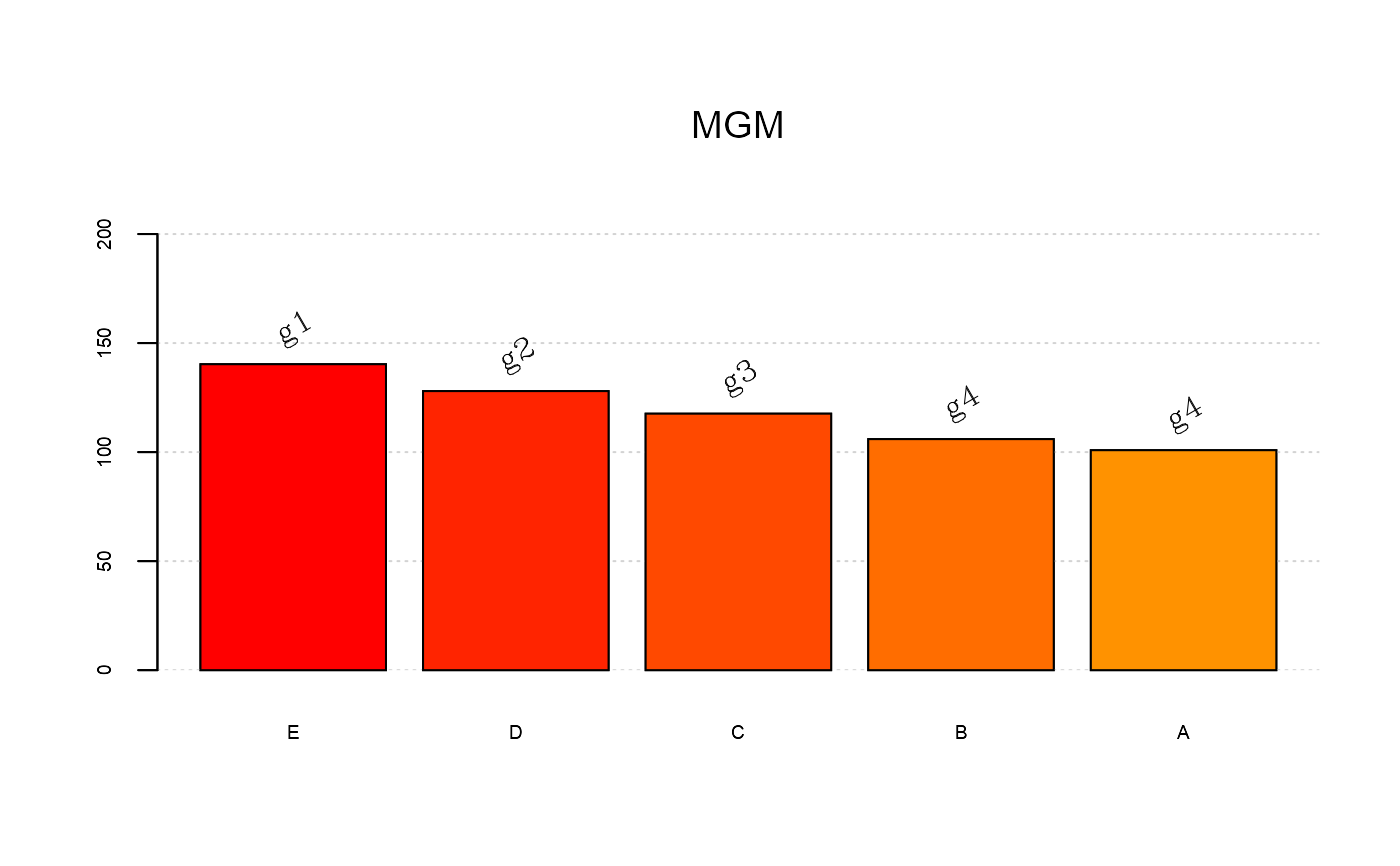
MRbarplot return the bar plot of the tests chosen
("MGM", "MGR", "SNKM" and "TM")
to evaluate the treatment means.
Details
The MCP argument allows choosing several tests
of multiple comparisons from the
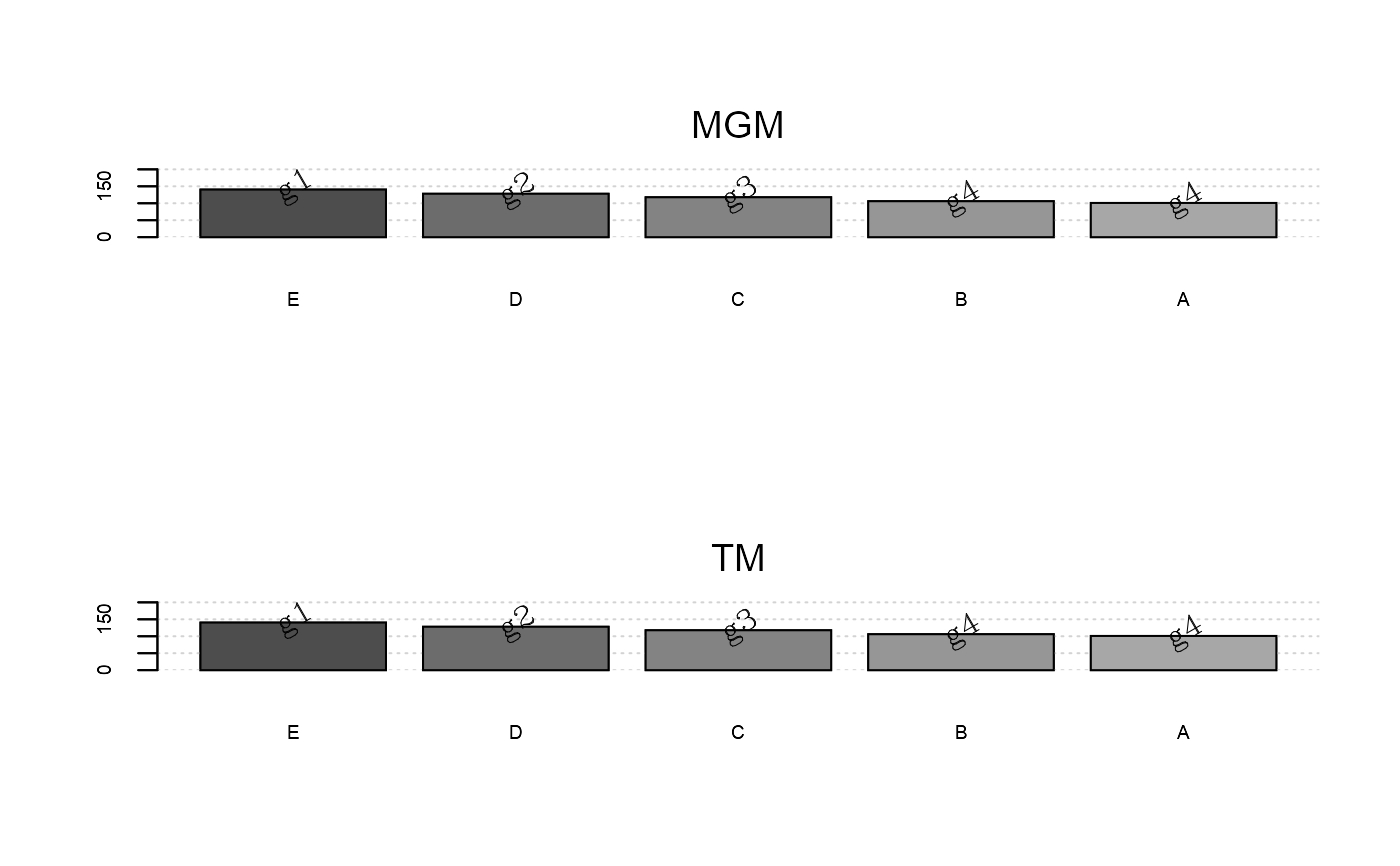
MRtest object. For plots in papers, use
col = gray.colors(10). For details, see
colors function.
Examples
# Simulated data (completely randomized design) rv <- c(100.08, 105.66, 97.64, 100.11, 102.60, 121.29, 100.80, 99.11, 104.43, 122.18, 119.49, 124.37, 123.19, 134.16, 125.67, 128.88, 148.07, 134.27, 151.53, 127.31) # Treatments treat <- factor(rep(LETTERS[1:5], each = 4)) # Anova res <- aov(rv~treat) # Loading the midrangeMCP package library(midrangeMCP) # Choosing tests results <- MRtest(y = res, trt = "treat", alpha = 0.05, main = "Multiple Comparison Procedures", MCP = c("MGM", "TM"))#> MCP's based on distributions of the studentized midrange and range #> #> Study: Multiple Comparison Procedures #> #> Summary: #> Means std r Min Max #> A 100.87 3.40 4 97.64 105.66 #> B 105.95 10.33 4 99.11 121.29 #> C 117.62 9.02 4 104.43 124.37 #> D 127.97 4.74 4 123.19 134.16 #> E 140.30 11.42 4 127.31 151.53 #> #> Mean Grouping Midrange Test #> #> Statistics: #> Exp.Mean CV MSerror Df n Stud.Midrange Ext.DMS Int.DMS #> 118.542 7.08182 70.47488 15 5 1.089968 5.90246 4.575105 #> #> Groups: #> Means Groups #> E 140.30 g1 #> D 127.97 g2 #> C 117.62 g3 #> B 105.95 g4 #> A 100.87 g4 #> #> Tukey Midrange Test #> #> Statistics: #> Exp.Mean CV MSerror Df n Stud.Midrange Ext.DMS Int.DMS #> 118.542 7.08182 70.47488 15 5 1.089968 5.90246 4.575105 #> #> Groups: #> Means Groups #> E 140.30 g1 #> D 127.97 g2 #> C 117.62 g3 #> B 105.95 g4 #> A 100.87 g4MRbarplot(results, MCP = "all") # It will be shown two# graphs. First, for the # results of \code{'MGM'} # and the second for the # results of \code{'TM'}. MRbarplot(results, MCP = "MGM") # It will be shown# only the graph # for the result of # \code{'MGM'} # Plot for papers MRbarplot(results, MCP = "all", col = gray.colors(10))