Resumo
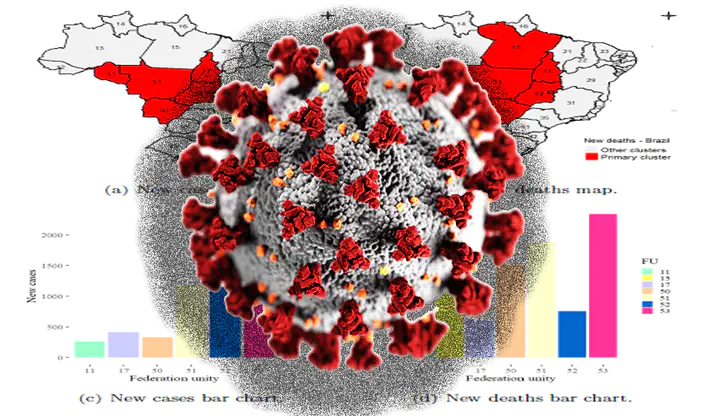
The COVID-19 pandemic has spread rapidly around the world in a frightening way. In Brazil, the third country with the highest number of infected and deaths from the disease, it is important for government health authorities to identify the federation units that stand out in cases and deaths from this disease to target resources. The circular scan statistic proposed by Martin Kulldorff allows to identify with some statistical significance the units of the federation that stand out in relation to the number of cases and deaths of COVID-19 in Brazil. Such units of federation are known as clusters. Once these clusters were identified, we used the coefficients of incidence and lethality to better describe the behavior of these clusters during three phases of the pandemic - the initial phase, the peak phase, and also the stability and fall phase. We observed changes in the location of the clusters identified in these three phases and used the R software and also the SaTScan software to obtain the maps and results, which were consistent with what was reported by the Brazilian media.